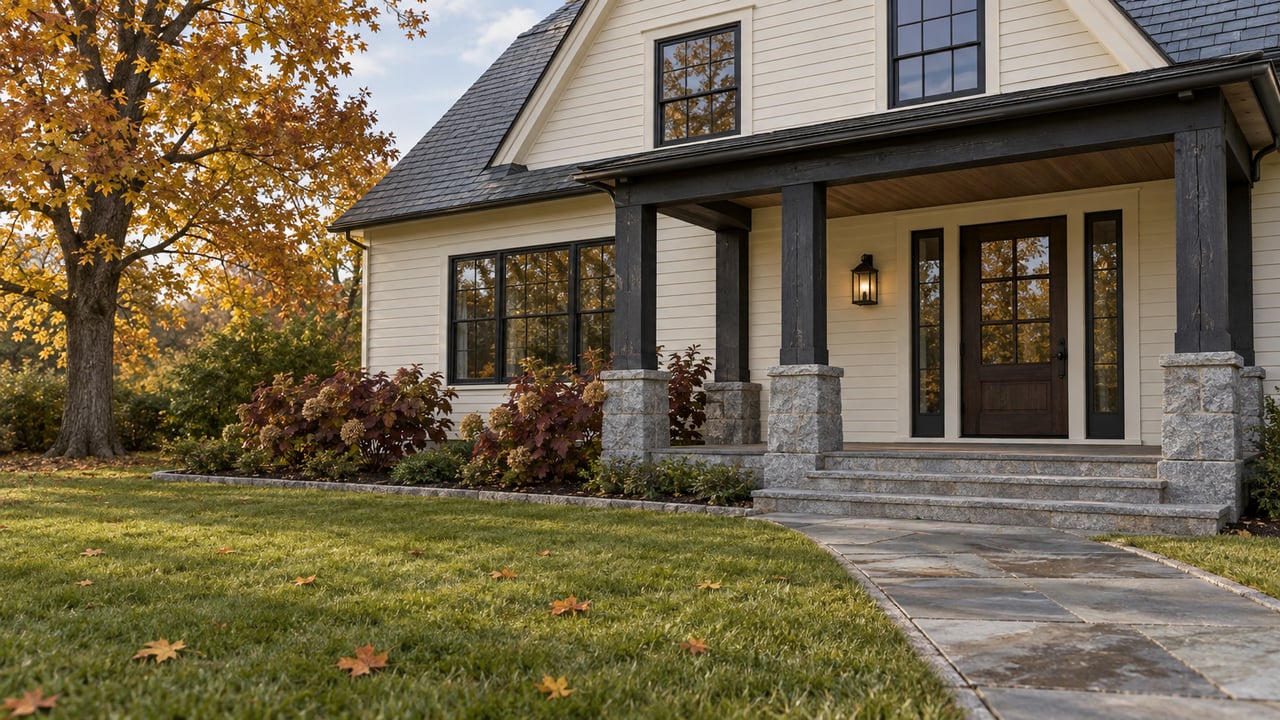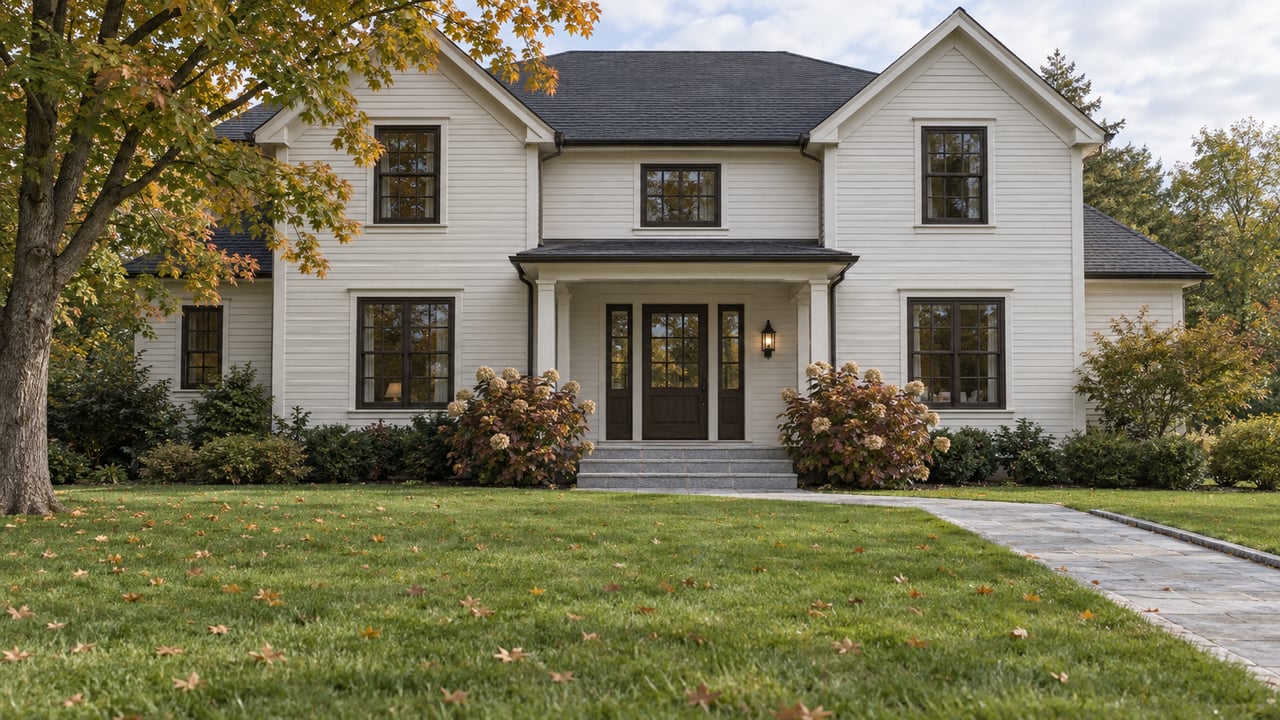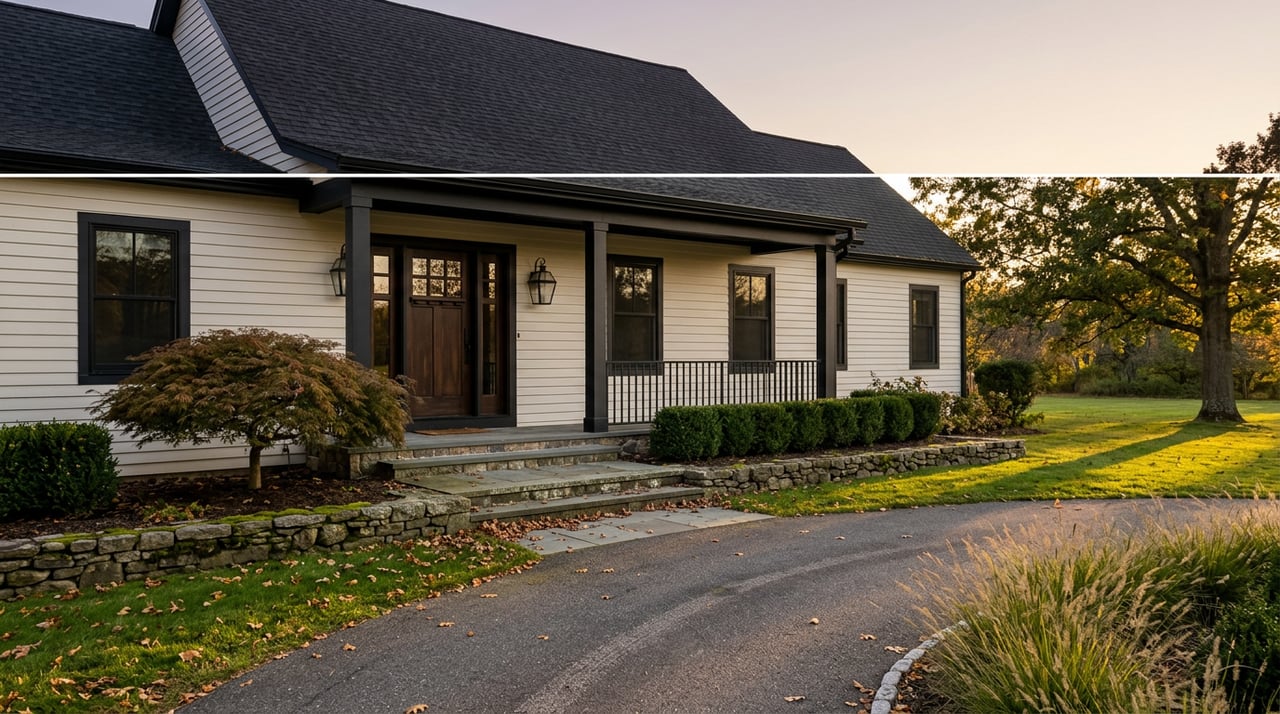
In July, a home near the seventh hole of the Weston Golf Club closed for $4.62 million. It wasn't the largest house to sell in Weston this year, not by a wide margin, ranking eighth by square footage among the town's 2026 closings. But it landed among the two highest price-per-square-foot sales the town has seen since the start of the year, according to Banker & Tradesman's weekly roundup of the state's priciest transactions. A view of a fairway, in other words, did more for the number than another thousand square feet would have.
That's a useful place to start, because it captures something the median price on any portal will never show you: inside Weston's high end, results are not moving together. Some properties still command a premium the moment they list. Others sit for months and close well under ask. If you're comparing Weston against another MetroWest town using a single number pulled off a search result, you're averaging two markets that are currently behaving in opposite directions.
One Median, Two Very Different Markets
Look across any handful of market snapshots taken this year and the headline price for Weston looks stable to strong. One broker's year-to-date report through early June showed single-family homes averaging $3.75 million across 42 closed sales, up from $2.88 million over the same stretch a year earlier. A separate three-month read through July put the median sale price at $2.7 million, up 3 percent year over year. Our own figures for Weston showed a median of $2.3 million in March 2026, up 7.6 percent from March 2025.
None of those numbers are wrong. They're measuring different windows, different sample sizes, and in some cases a different definition of "median" entirely. But taken together, they tell a story of a town where prices are holding, maybe even climbing. That story is true for part of the market and false for the rest of it.
Why the Averages Keep Climbing While Sellers Are Cutting Deals
Here's the part that doesn't show up in a single headline stat: an analysis of Massachusetts sales data from this spring identified Weston, alongside Lexington, as one of the softest top-tier markets in the metro area. Homes priced at $2 million and above were closing at roughly 91.9 percent of list price this spring, down from close to 99 percent a year earlier, with a median of around 107 days on market for that segment. A separate report covering late spring reached a similar conclusion from a different angle, noting that Weston, Wellesley, Concord, Winchester, and Newton were now selling their top-tier inventory only after 70 to 120 days, even as sale-to-list ratios held in the high 90s for the properties that did move.
Meanwhile, the same year-to-date broker report that showed average sale prices climbing to $3.75 million also showed the average discount off asking widening, from homes selling at 97.8 percent of list a year earlier to 96.4 percent this year, with the typical home now taking 63 days to reach an accepted offer instead of moving faster.
Put those two facts side by side and the mechanism becomes clear. A rising average price doesn't require every home to be selling for more. It only requires more of the closings in a given window to be large, expensive properties, even if each of those properties is individually taking longer and closing further under ask than it would have a year ago. Weston's average climbed this year in part because bigger houses made up more of what actually closed, not because buyers got more aggressive.
The Fine Print Behind "Days on Market"
There's a second layer to this, and it's one that trips up out-of-town buyers comparing Weston to wherever they're moving from. "Days on market" doesn't mean the same thing depending on where you read it.
| What's being measured | What it typically captures |
|---|---|
| Days to accepted offer | Time from listing to a signed offer, the number most local board reports lead with |
| Days to closing | Time from listing through the full purchase and sale process to the closing table |
One spring analysis of the broader metro market noted that the closing-based figure typically runs 30 to 45 days longer than the offer-based figure for the same set of homes. So when one source says a Weston luxury listing spent 65 days on market and another says a comparable property spent 107, they may both be right. They're just stopping the clock at different points in the transaction.
The same confusion shows up in how "median" gets calculated. Some reports track closed sales, what buyers actually paid. Others track active listings, what sellers are currently asking. A luxury-focused snapshot this spring put Weston's active median listing price at $3.61 million while the closed-sale median for the broader market sat closer to $2.56 million over the same window. That's not a contradiction. It's the difference between what's for sale right now and what actually sold.
Even the "Top Sale of the Year" Depends on Who's Counting
If you want proof that even the simplest-sounding number in this market isn't simple, look at how differently Weston's biggest 2025 sale gets reported. One summary of the year's Warren Group data, drawn from Weston Observer reporting, lists the year's top sale as $14.3 million. A separate agent's recap of the same year's closings puts the ceiling at $11 million, describing it as a new construction sale. Both cite the same underlying pool of 167 Weston transactions and roughly 15 sales above $5 million in 2025. The gap between those two headline figures likely comes down to which closings each source chose to include and how each one classified a handful of off-market or unusually structured deals at the very top of the range.
The takeaway isn't that one figure is right and the other wrong. It's that at Weston's price point, the tail of the distribution is thin enough that a single sale or a single reporting choice can move the "record" by several million dollars. That's a reminder to treat any single superlative statistic about this market with some caution, and to ask what's actually included before repeating it.
What This Means If You're Pricing or Shopping an Estate in Weston
For sellers with a true estate-tier property, the practical read is straightforward. The $1 million to $2 million move-up segment in Weston has kept moving at a pace close to what it saw a year ago. The $3 million-plus segment has not. If your home sits in that upper band, expect a longer runway to an accepted offer, budget for more negotiation once you're under agreement, and treat a strong opening two weeks as your best shot at the price you actually want. A property that leans on presentation, staging, and a clear narrative from day one is working with the market as it currently behaves, not against it.
For buyers looking at Weston's high end, the same data cuts the other way. A softer sale-to-list ratio and a longer median market time mean there's real room to negotiate on well-priced estate listings that have been sitting, even in a town where headline prices still look firm. The properties moving quickly and near list are the exception right now, not the rule, at the top of the market specifically.
Either way, the number you should be asking about isn't the town-wide median. It's the sale-to-list ratio and median days on market for homes that actually resemble the one you're buying or selling, in the price band that actually applies to you.
A Few Questions We Hear Often
Does this mean Weston prices are actually falling? Not across the board. The move-up segment, roughly $1 million to $2 million, has held closer to last year's pace. The softening shows up specifically in the $2 million-plus tier, where discounts off list and time on market have both grown compared to a year earlier.
Is this happening everywhere in MetroWest, or just Weston? Reports from this spring identified the same pattern in several nearby towns, including Lexington, Newton, Wellesley, Concord, and Winchester. It's a broader luxury-tier trend across the metro, not something unique to Weston.
How do I find out where my specific price band stands right now? The town-wide median mixes segments moving at very different speeds, so it won't answer that question on its own. A recent comparable sale in your specific price range and property type, ideally within the last few months, is a far more reliable guide than any headline figure.
If you're weighing a purchase or a sale in Weston's estate market and want a read that's specific to your price point rather than the town average, the Donahue | Maley | Burns Team can walk through the comparable sales that actually apply to your situation. Schedule your complimentary home valuation and get a number grounded in what's closing in your segment right now, not the average of two markets moving in different directions.